Tip of the Week: Fiddler - Free Web Debugging Proxy
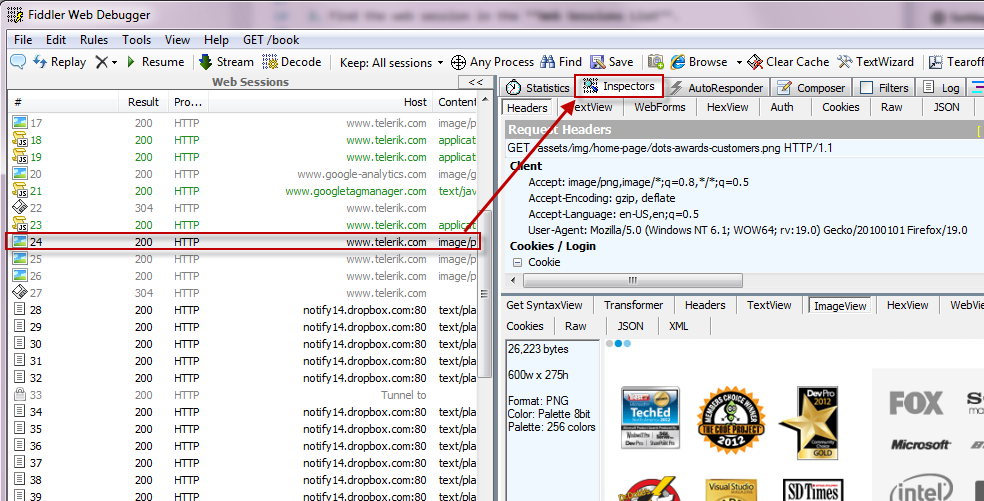
Fiddler is an HTTP debugging proxy server application and captures HTTP and HTTPS traffic. It is one of the tools in my essential toolkit list. Fiddler allows debugging traffic from PC, MAC, Linux and mobile systems. It helps inspect the raw requests and responses between the client and the server.

Some of the key features that I often use in Fiddler are
- Inspect Request/ResponseLook into the request and response data to see if all the required headers/attributes are set, and the data is sent as expected
- Compose Web RequestsManually compose requests to send to server and test endpoints.
- AutoRespond to RequestsIntercept requests from the browser and send back a pre-defined response or create a delay in response to the actual client.
- StatisticsFiddler statistics give an overview of the performance details of a web session, indicating where the time is spent in the whole request/response cycle.
- Modify and Replay a RequestFiddler allows modifying the request by editing its contents and replay the message to the server.
- Export and ImportFiddler makes it easy to share captured traces with different people. All captured traffic or selected requests can be exported and shared with others. The exported saz file can be opened in Fiddler to view back all the session details.
These are some of the features that I use on a regular basis. Fiddler supports a lot more and is extensible to support custom requirements as well. I find it an indispensable tool when developing for the Web. Get Fiddler if you have not already.