How To Easily Get Started with AWS Lambda Tracing in .NET using Powertools
Powertools for AWS Lambda (.NET) Tracing, is an opinionated wrapper for AWS X-Ray .NET SDK, aimed to reduce the overhead of performing common tracing tasks. Let’s explore how to easily get started with using the Lambda Powertools Tracing library when building AWS Lambda Functions in .NET.
Table of Contents
Powertools for AWS Lambda (.NET) Tracing, is an opinionated wrapper for AWS X-Ray .NET SDK, aimed to reduce the overhead of performing common tracing tasks.
Some of the key features that the Powertools provides for tracing include attribute annotation, helper methods to easily add annotations and custom segments, capture function responses and exceptions as metadata, etc.
In this blog post, let’s explore how to easily get started with using the Lambda Powertools Tracing library when building AWS Lambda Functions in .NET.
Enabling Lambda Powertools Tracing
To see the Lambda Powertools Tracing library in action, let's first create a Lambda Function.
Let's use the AWS Lambda Annotations Library to quickly create an API Endpoint using Lambda backend.
To an empty Lambda function project add Amazon.Lambda.Annotations, Amazon.Lambda.APIGatewayEvents and AWS.Lambda.Powertools.Tracing NuGet packages.
To enable Tracing all we need to do is add the Tracing attribute to the required Lambda function handler as shown below.
For this function to write to AWS Cloudwatch and AWS X-Ray it needs the appropriate permissions. The AWSXRayDaemonWriteAccess and AWSLambdaBasicExecutionRole are in-built role policies that give the required permissions.
[LambdaFunction(Policies = "AWSXRayDaemonWriteAccess, AWSLambdaBasicExecutionRole")]
[HttpApi(LambdaHttpMethod.Get, template: "/{cityName}")]
[Tracing]
public List<WeatherForecast> GetWeather(string cityName, ILambdaContext context)
{
    return new List<WeatherForecast>
    {
        new WeatherForecast
        {
            CityName = cityName,
            Date = DateTime.Today,
            TemperatureC = Random.Shared.Next(-10, 50)
        }
    };
}
The Function returns a hardcoded list of WeatherForecast objects for a given cityName.
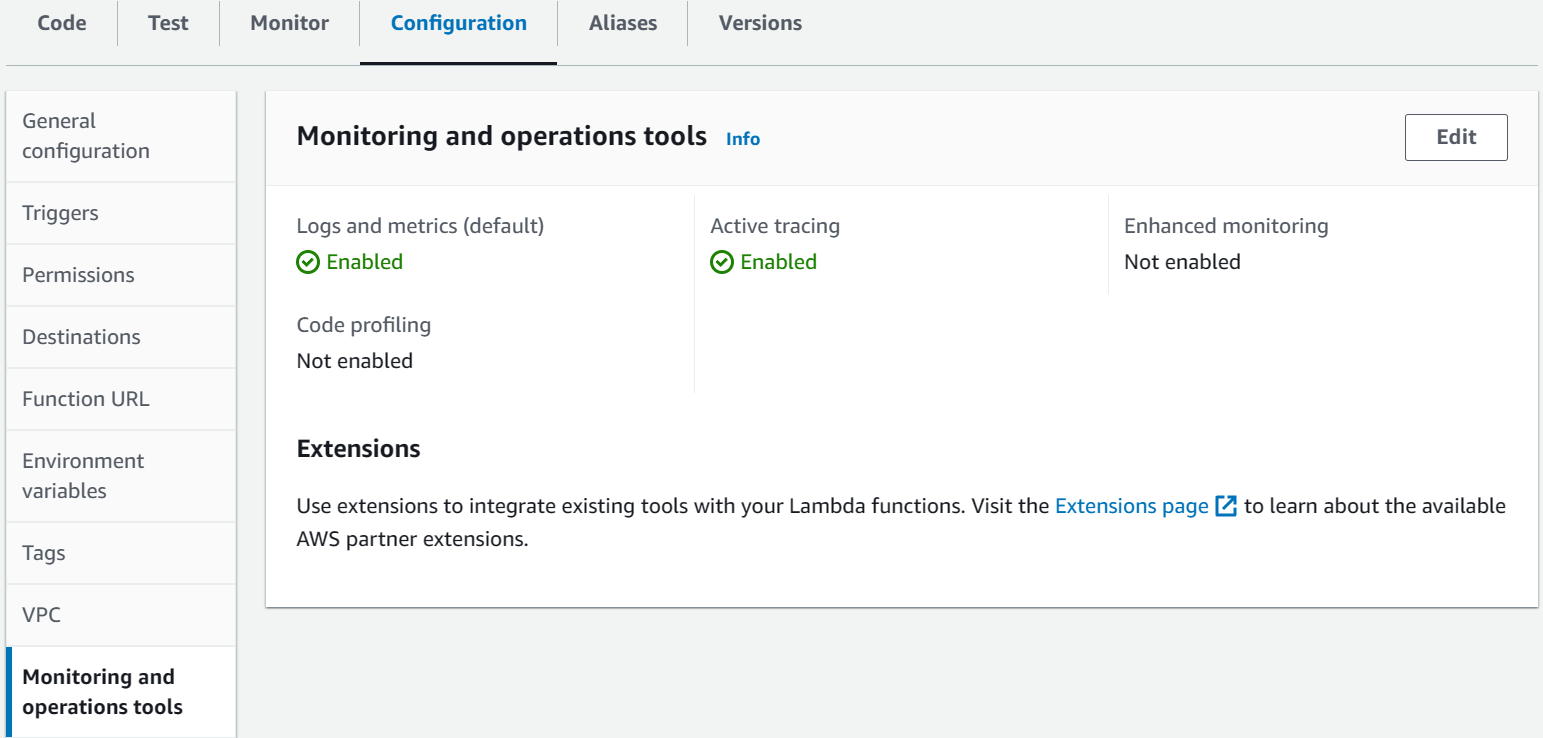
Once deployed to AWS, make sure to enable 'Active Tracing' for the Lambda function under the 'Monitoring and operations tools' in the Configuration section of the Lambda Function.
As you make requests to the API Gateway endpoint for the deployed API endpoint, it starts collecting trace information for the API request.
You can view the Trace under the Monitor → Traces section for the AWS Lambda Function.
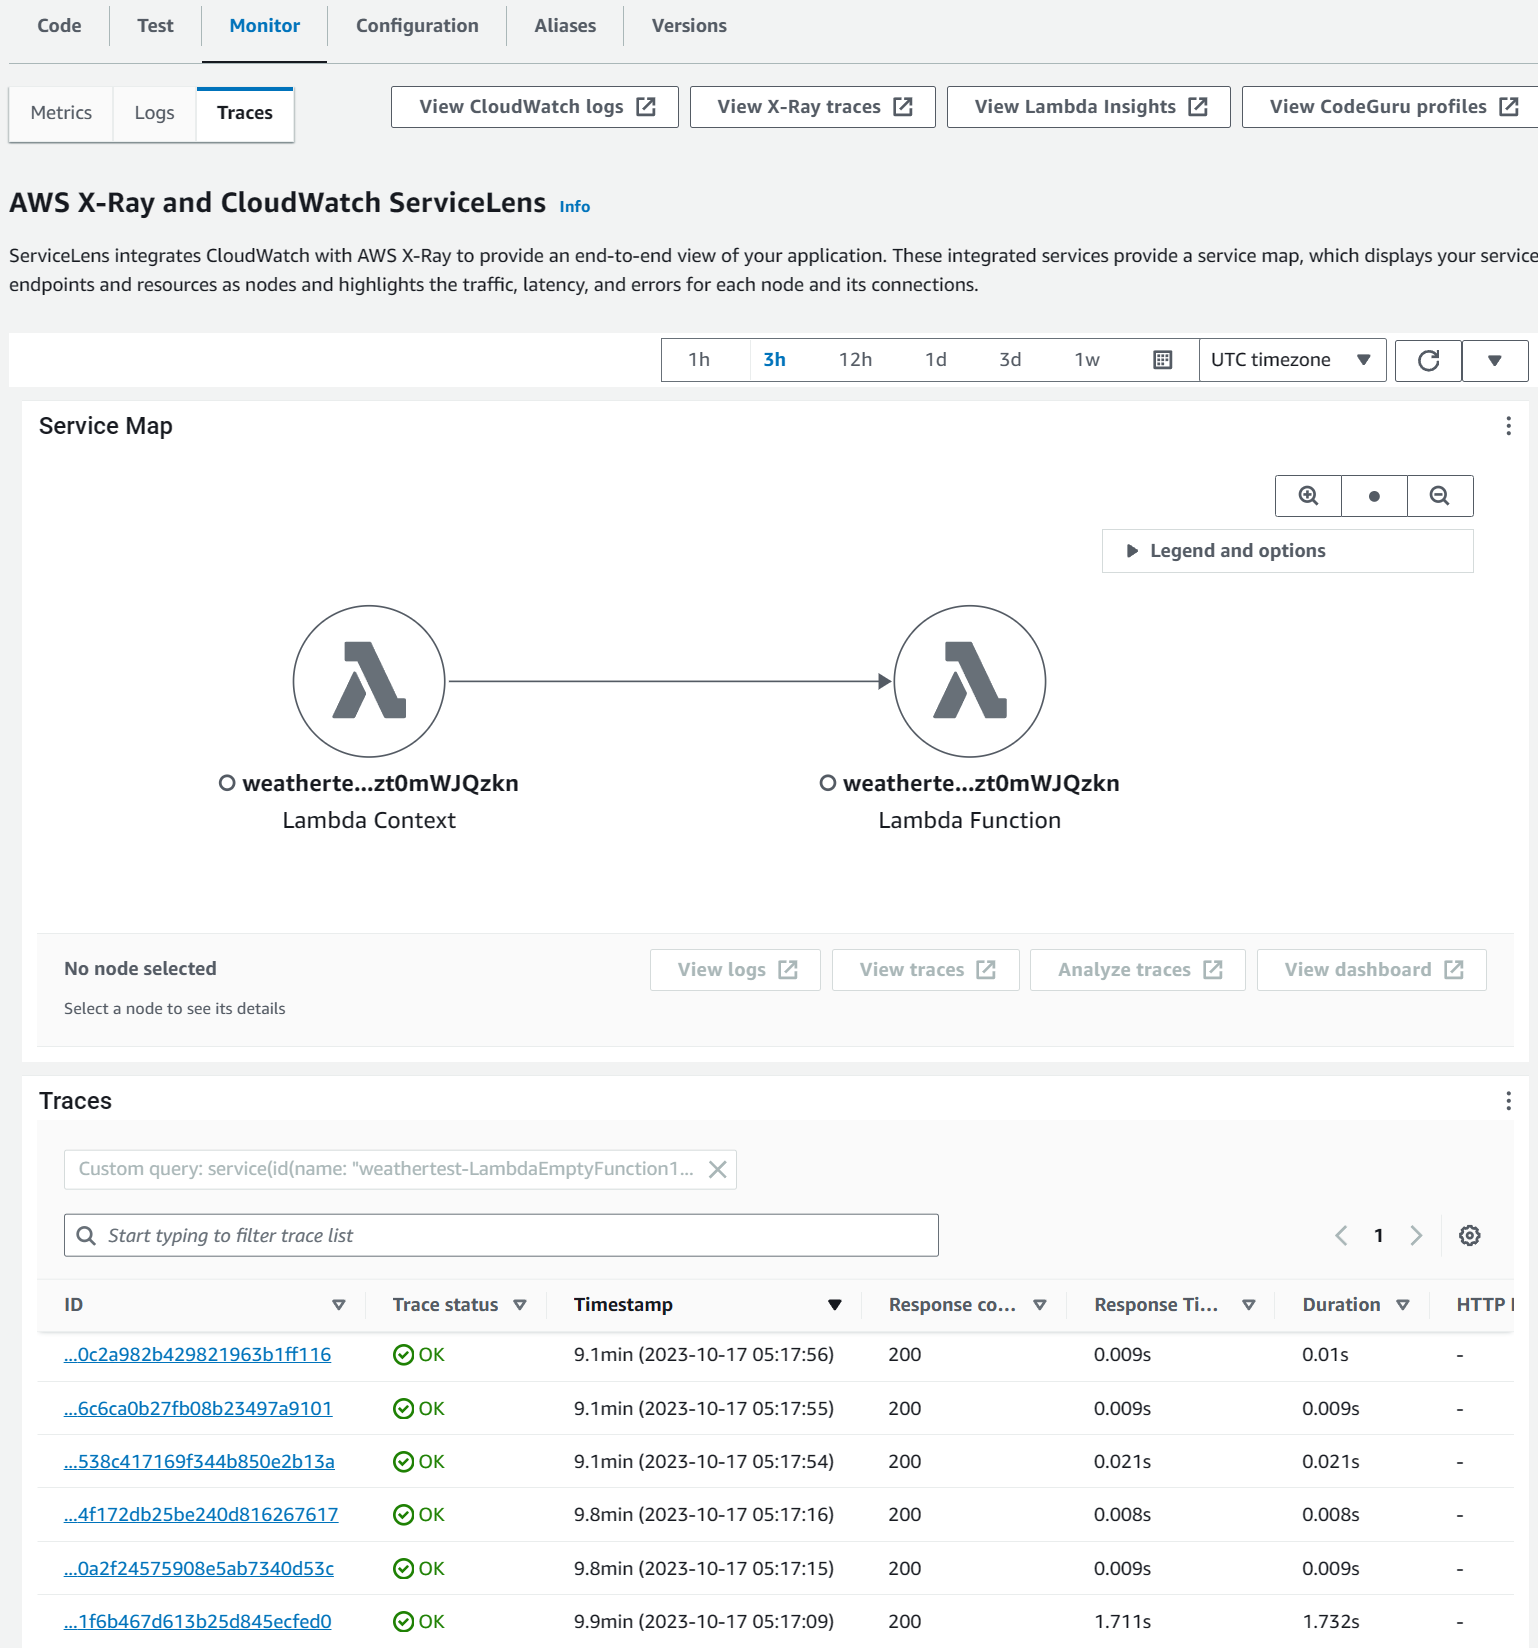
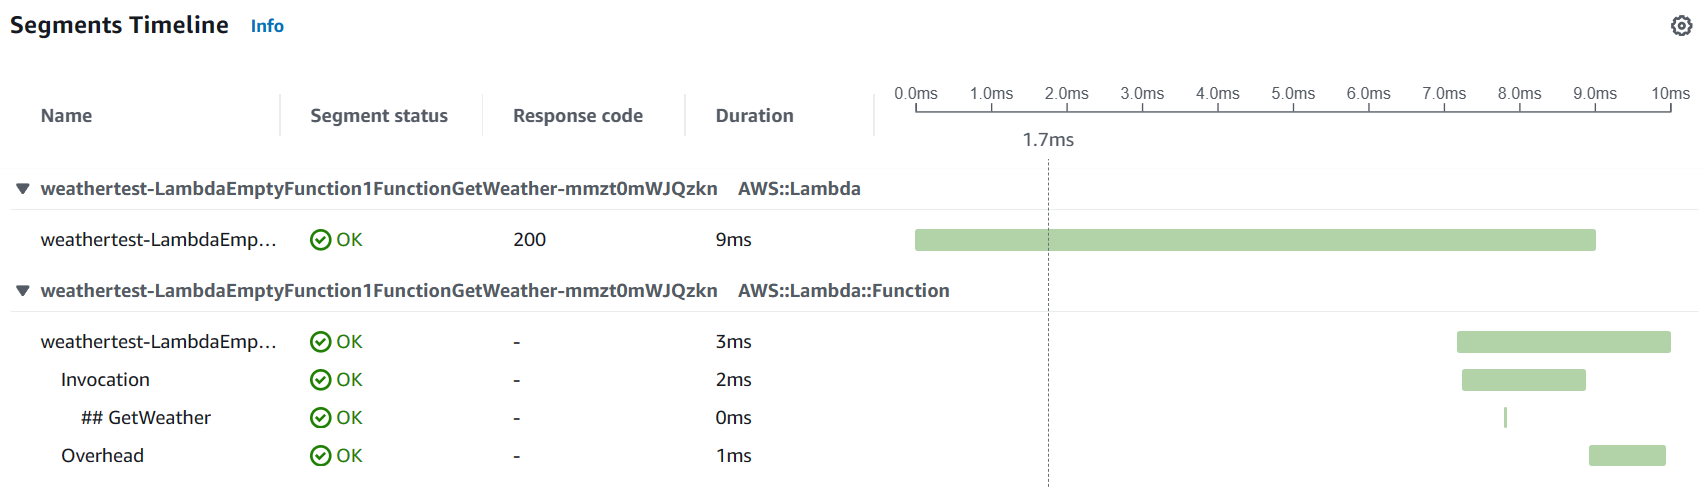
You can drill into each of the Trace entries to see more details about the specific trace entry.
If you are new to AWS X-Ray, check out the video below to get started.
Additional Segments
The Tracing library allows capturing additional sub-segments for the main function call.
You can do this by annotating any of the C# Functions with the Tracing attribute like before, or explicitly using the helper method WithSubsegment on the Tracing class.
Below is an example function that the main Lambda Function Handler calls into now to generate the fake WeatherForecast data.
By annotating the function with the Tracing attribute, the function gets automatically traced as a sub-segment.
[Tracing]
public async Task<List<WeatherForecast>> GenerateFakeDataWithDelay(string cityName)
{
    await Task.Delay(1000);

    Tracing.WithSubsegment(
            "TimeConsumingSubProcess", async _ => { await Task.Delay(500); });

    return new List<WeatherForecast>
    {
        new WeatherForecast
        {
            CityName = cityName,
            Date = DateTime.Today,
            TemperatureC = Random.Shared.Next(-10, 50)
        }
    };
}
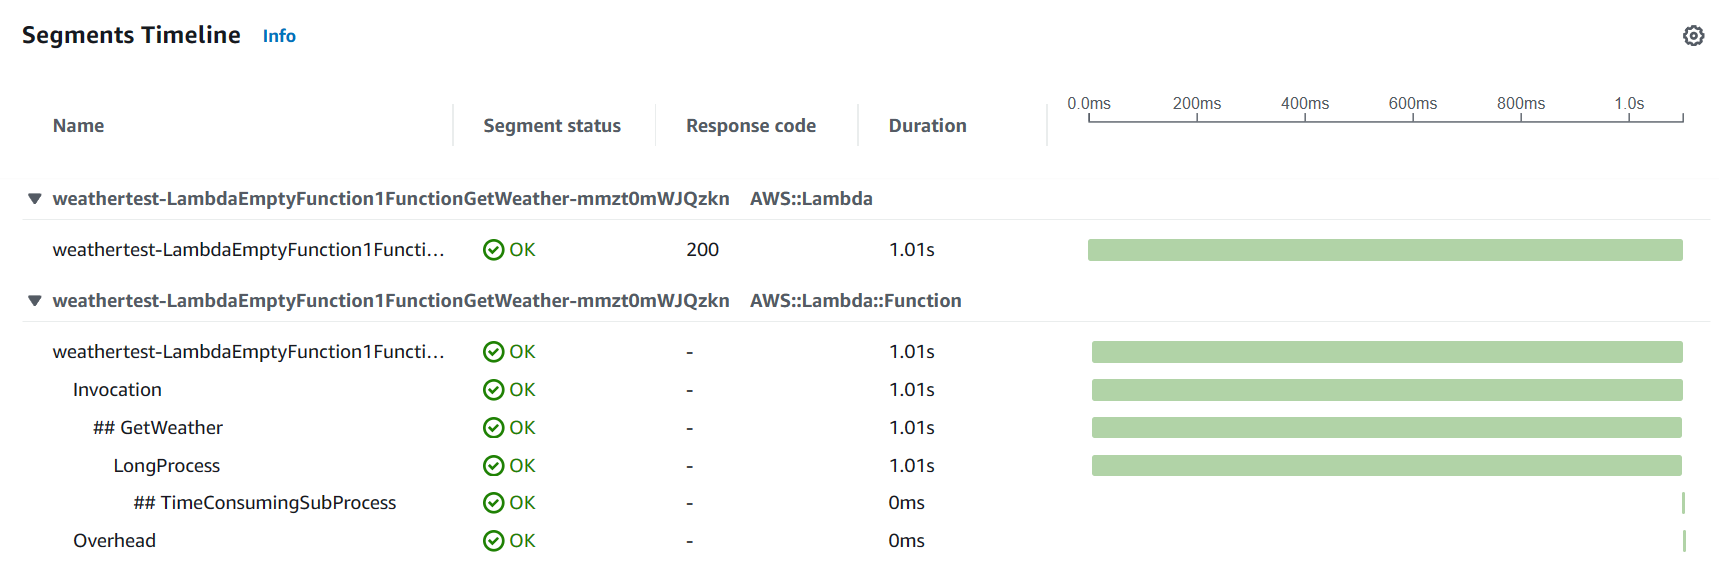
You can see the new sub-segments for the new traces in the AWS Console as shown below.
Annotations and Metadata
AWS X-Ray allows the recording of additional information about requests, the environment, or the application with annotations and metadata.
Annotations and Metadata are attached to the segment or sub-segment and are both key-value pairs.
Annotations are indexed for use with filter expressions while Metadata are not indexed and cannot be used in the filter expressions.
The Tracing class from the Powertools Tracing library exposes two methods, AddAnnotation and AddMetadata to add annotations and metadata to the trace segment.
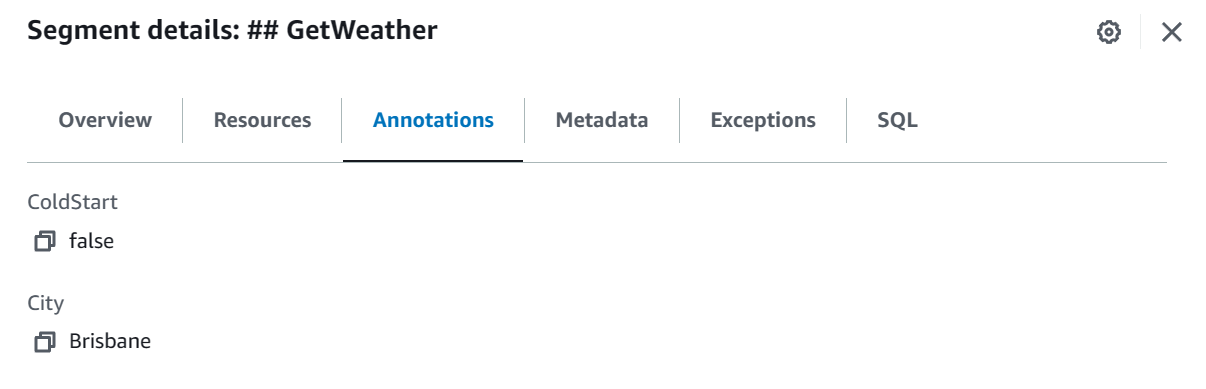
Tracing.AddAnnotation("City", cityName);
Tracing.AddMetadata("Count", results.Count);
Annotations and Metadata are shown under the corresponding segment detail in the AWS Console as key-value pairs, as shown in the screenshot below.
Instrumenting Other AWS Services
Often when building Lambda Functions we integrate with other AWS Services, like DynamoDB, SQS, SNS, Secrets Manager, etc. In these cases, you use the appropriate .NET Nuget packages to talk to these services.
You can instrument all calls made using the AWS SDK for .NET clients by calling the RegisterForAllServices method on the Tracing class. Ensure to make this call before the .NET client is instantiated.
The below code shows how to register the DynamoDB client to be captured into the Trace information.
public Function()
{
    Tracing.RegisterForAllServices();
    dynamoDbContext = new DynamoDBContext(new AmazonDynamoDBClient());
}
In the Function constructor, before creating the DynamoDBContext instance, call the RegisterForAllServices helper function.
The actual Lambda function code now uses the DynamoDBContext to retrieve Weather forecast data for a given city name.
[LambdaFunction(Role = "@WeatherApiLambdaExecutionRole")]
[HttpApi(LambdaHttpMethod.Get, template: "/{cityName}")]
[Tracing(Namespace = "GetWeather")]
public async Task<List<WeatherForecast>> GetWeather(string cityName, ILambdaContext context)
{
Tracing.AddAnnotation("City", cityName);
var results = await dynamoDbContext.QueryAsync<WeatherForecast>(cityName).GetRemainingAsync();
Tracing.AddMetadata("Count", results.Count);
return results;
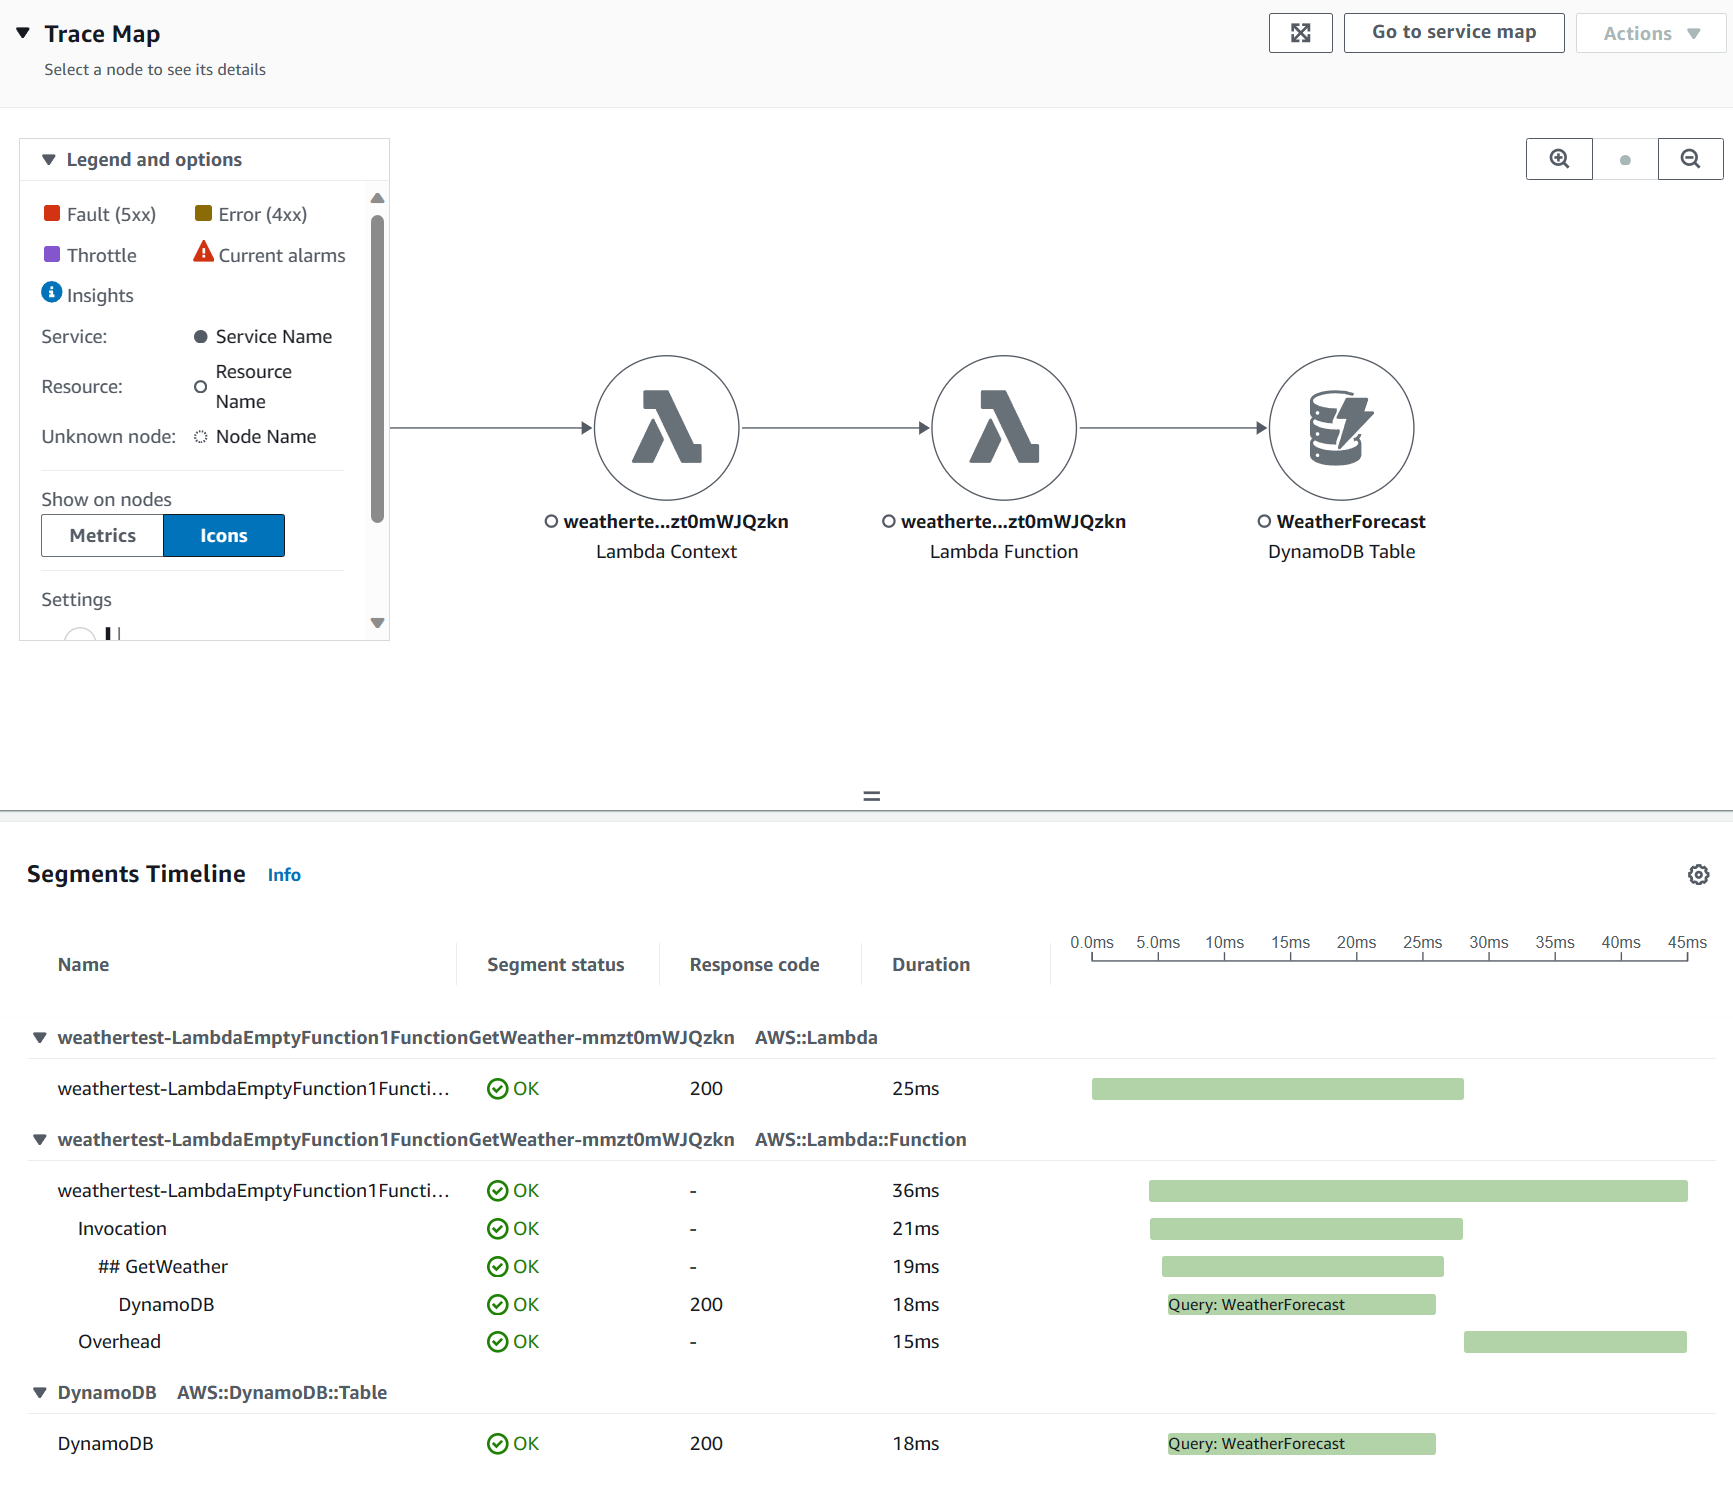
}You can see the calls to DynamoDB in the trace information as shown below in the screenshot.
Similarly, you can show the trace information to any external AWS Services and also other HTTP client calls that you make from your application.
This makes it very easy to keep track of tracing information to external dependencies.

Rahul Nath Newsletter
Join the newsletter to receive the latest updates in your inbox.
