Setting Up CloudWatch Agent on EC2: Monitor Memory and Disk Usage
Let's learn how to set up CloudWatch Agent on EC2 instances to monitor additional metrics like memory and disk usage. We'll walk through the manual setup process and configure it for instances in an Auto Scaling Group.
Out of the box, EC2 gives you basic metrics like CPU and network usage. But if you want additional metrics like memory usage and disk space, you'll need to install the CloudWatch Agent.
In this post, we'll walk through:
- Understanding default EC2 metrics and their limitations
- What the CloudWatch Agent is and why you need it
- Setting up the CloudWatch Agent manually using the AWS Console
- Configuring the agent for multiple instances in an Auto Scaling Group
- Viewing custom metrics in CloudWatch
This video is part of my Amazon EC2 series and thanks to AWS for sponsoring it.
This post covers manual setup, which doesn't scale well. In upcoming post, we'll explore automating this process using User Data scripts and custom AMIs.
Default CloudWatch EC2 Metrics
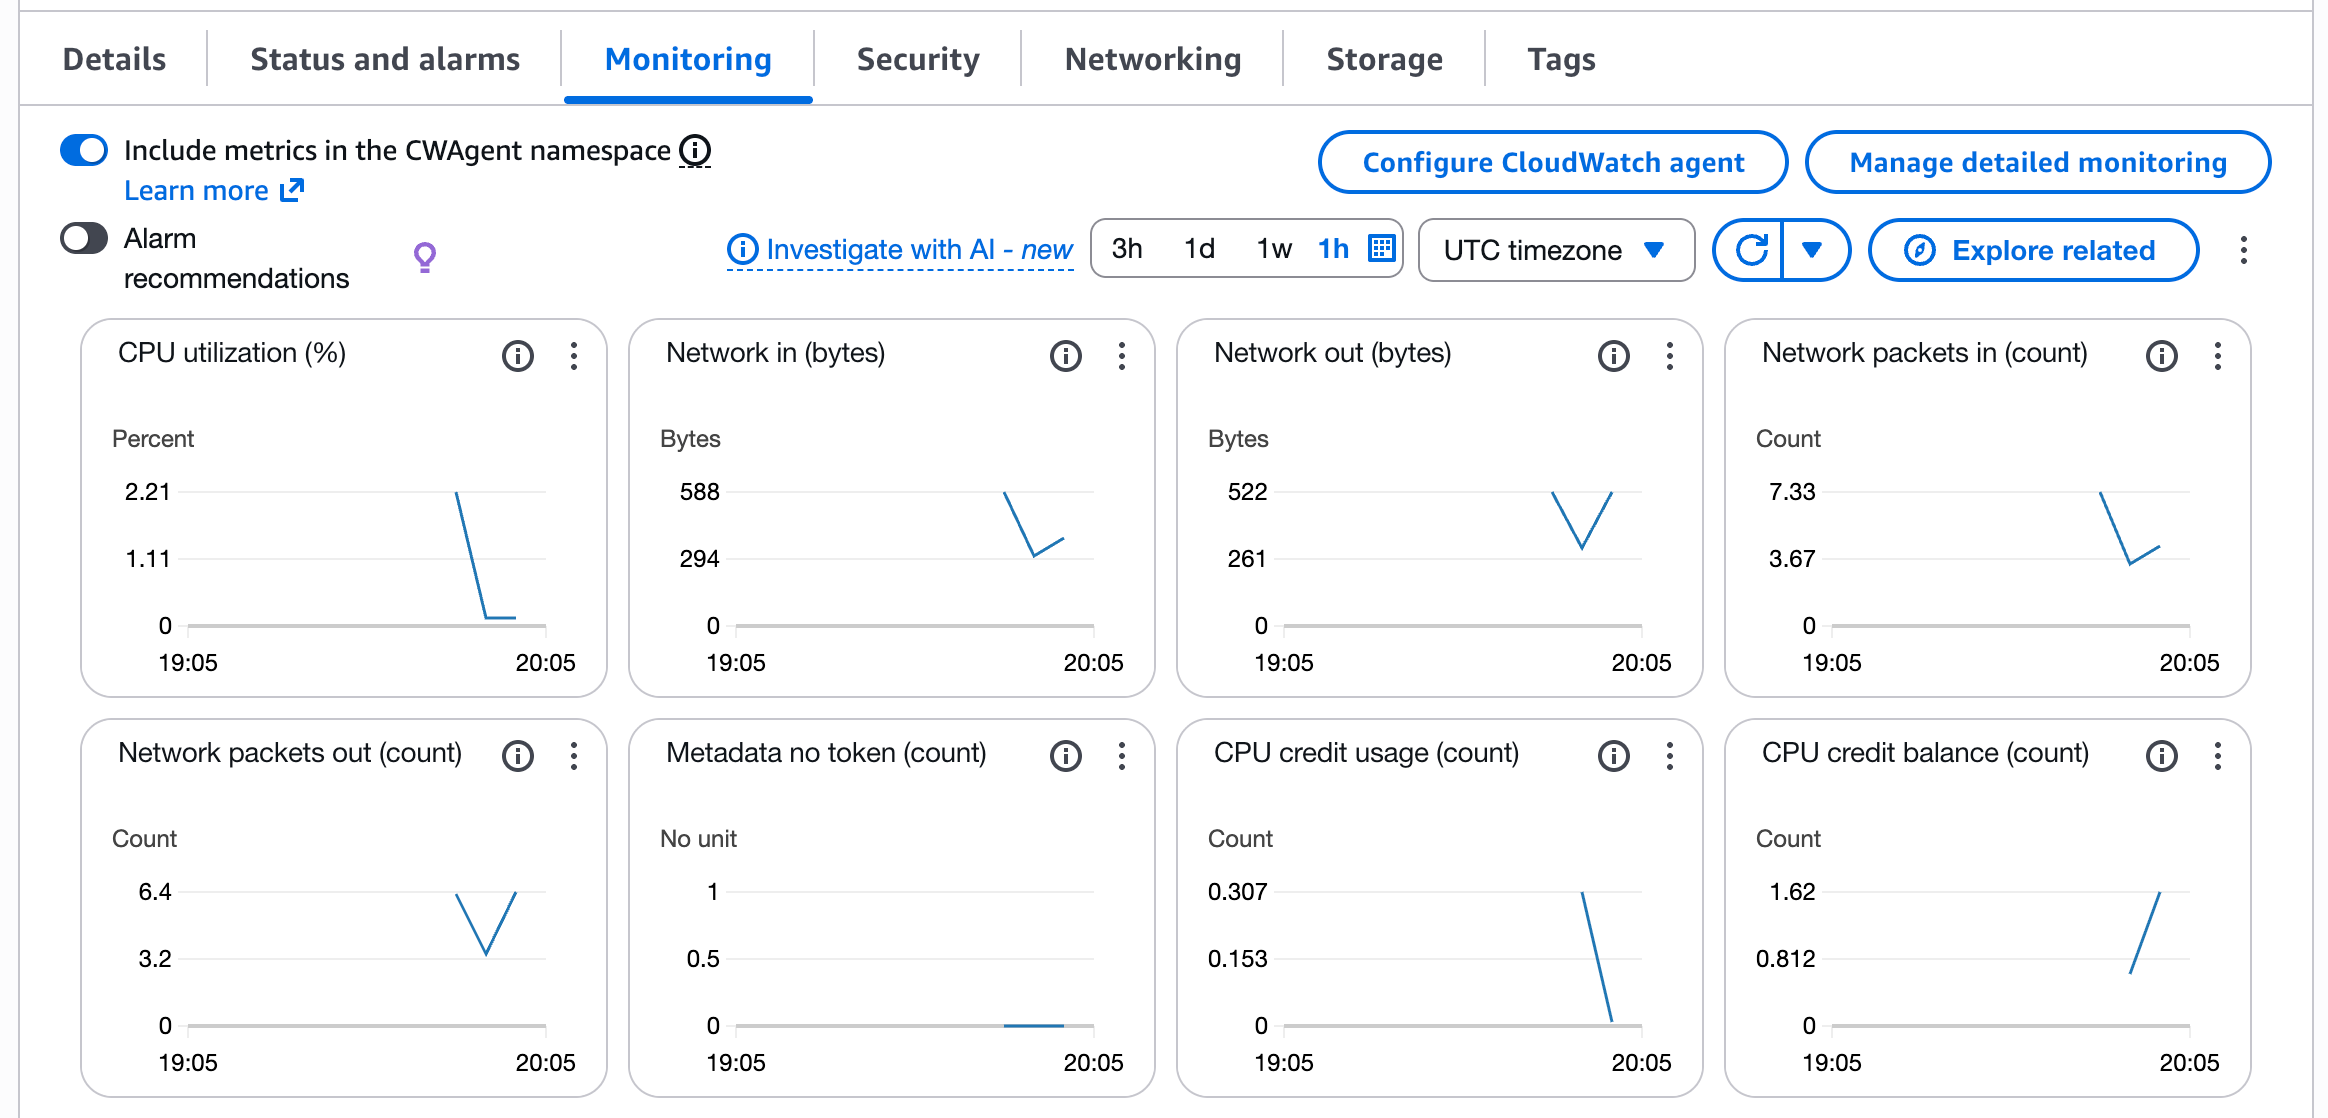
When you create an EC2 instance, AWS automatically provides several basic metrics at no additional cost:
- CPU utilization and credit metrics
- Network in/out
- Disk read/write operations (for instance store volumes)
- Status check metrics
By default, these metrics are collected at 5-minute intervals. You can enable detailed monitoring to reduce this to 1-minute intervals.
You can view these metrics by navigating to your EC2 instance in the AWS Console and checking the Monitoring and Storage tabs.
Metric Resolution and Granularity
CloudWatch supports two types of metric resolutions:
- Standard resolution: Data with 1-minute granularity
- High resolution: Data with 1-second granularity
To change from the default 5-minute interval to 1-minute:
- Navigate to your EC2 instance
- Go to Actions → Monitor and troubleshoot → Manage detailed monitoring
- Enable detailed monitoring
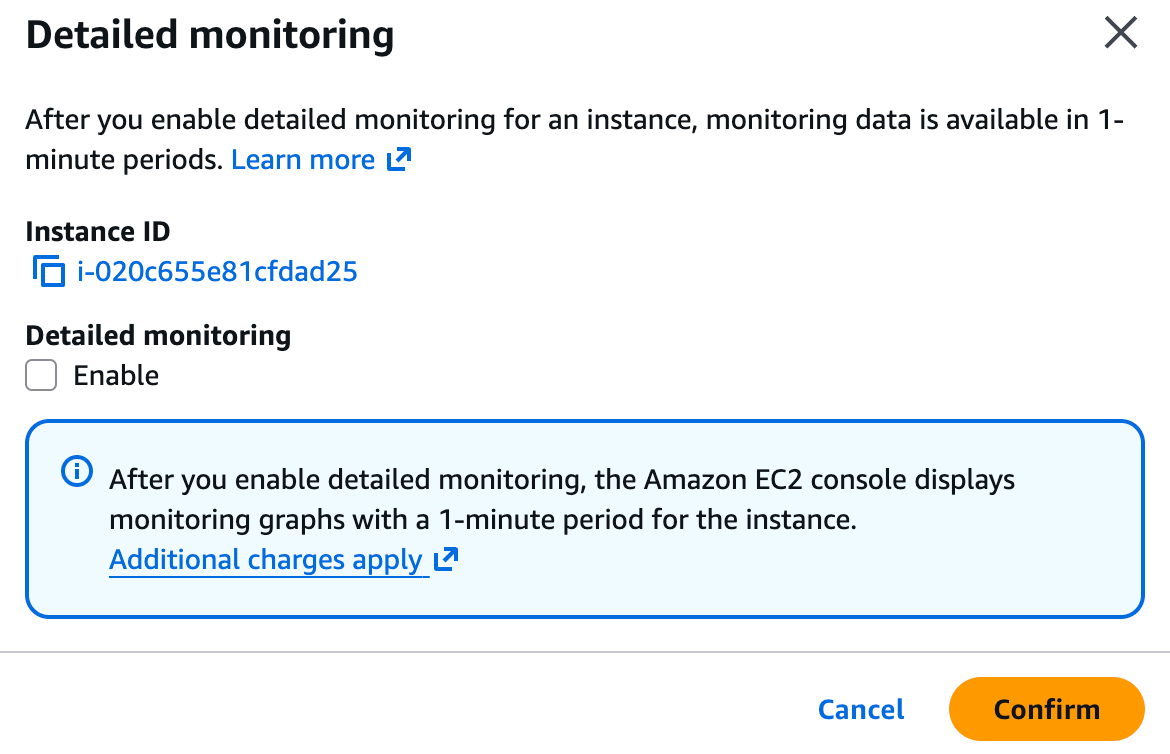
For even finer granularity (down to 1 second) and access to metrics like memory and disk space, you'll need the CloudWatch Agent.
What is Amazon CloudWatch Agent?
The CloudWatch Agent is an AWS tool that lets you collect detailed system-level metrics from your EC2 instances — things like memory usage, disk space, and disk utilization — which aren't available with EC2's default monitoring.
Key benefits:
- Custom metrics: Collect metrics not available by default (memory, disk space, swap usage)
- Higher frequency: Push metrics at a higher frequency for more granular insights
- Process-level metrics: Monitor specific processes, thread counts, and resource usage
- Unified monitoring: All metrics integrate directly with CloudWatch for centralized dashboards and alerts
Setting Up CloudWatch Agent
Let's walk through setting up the CloudWatch Agent on an EC2 instance using the AWS Console wizard.
Prerequisites
Before we start, ensure your EC2 instance has:
- SSM Agent installed - Most Amazon Linux 2023 and recent AMIs come with SSM Agent preinstalled
- Required IAM permissions - The instance role needs specific policies (we'll add these next)
Adding Required IAM Permissions
Navigate to your EC2 instance and click Configure CloudWatch agent. The wizard will check for required permissions.
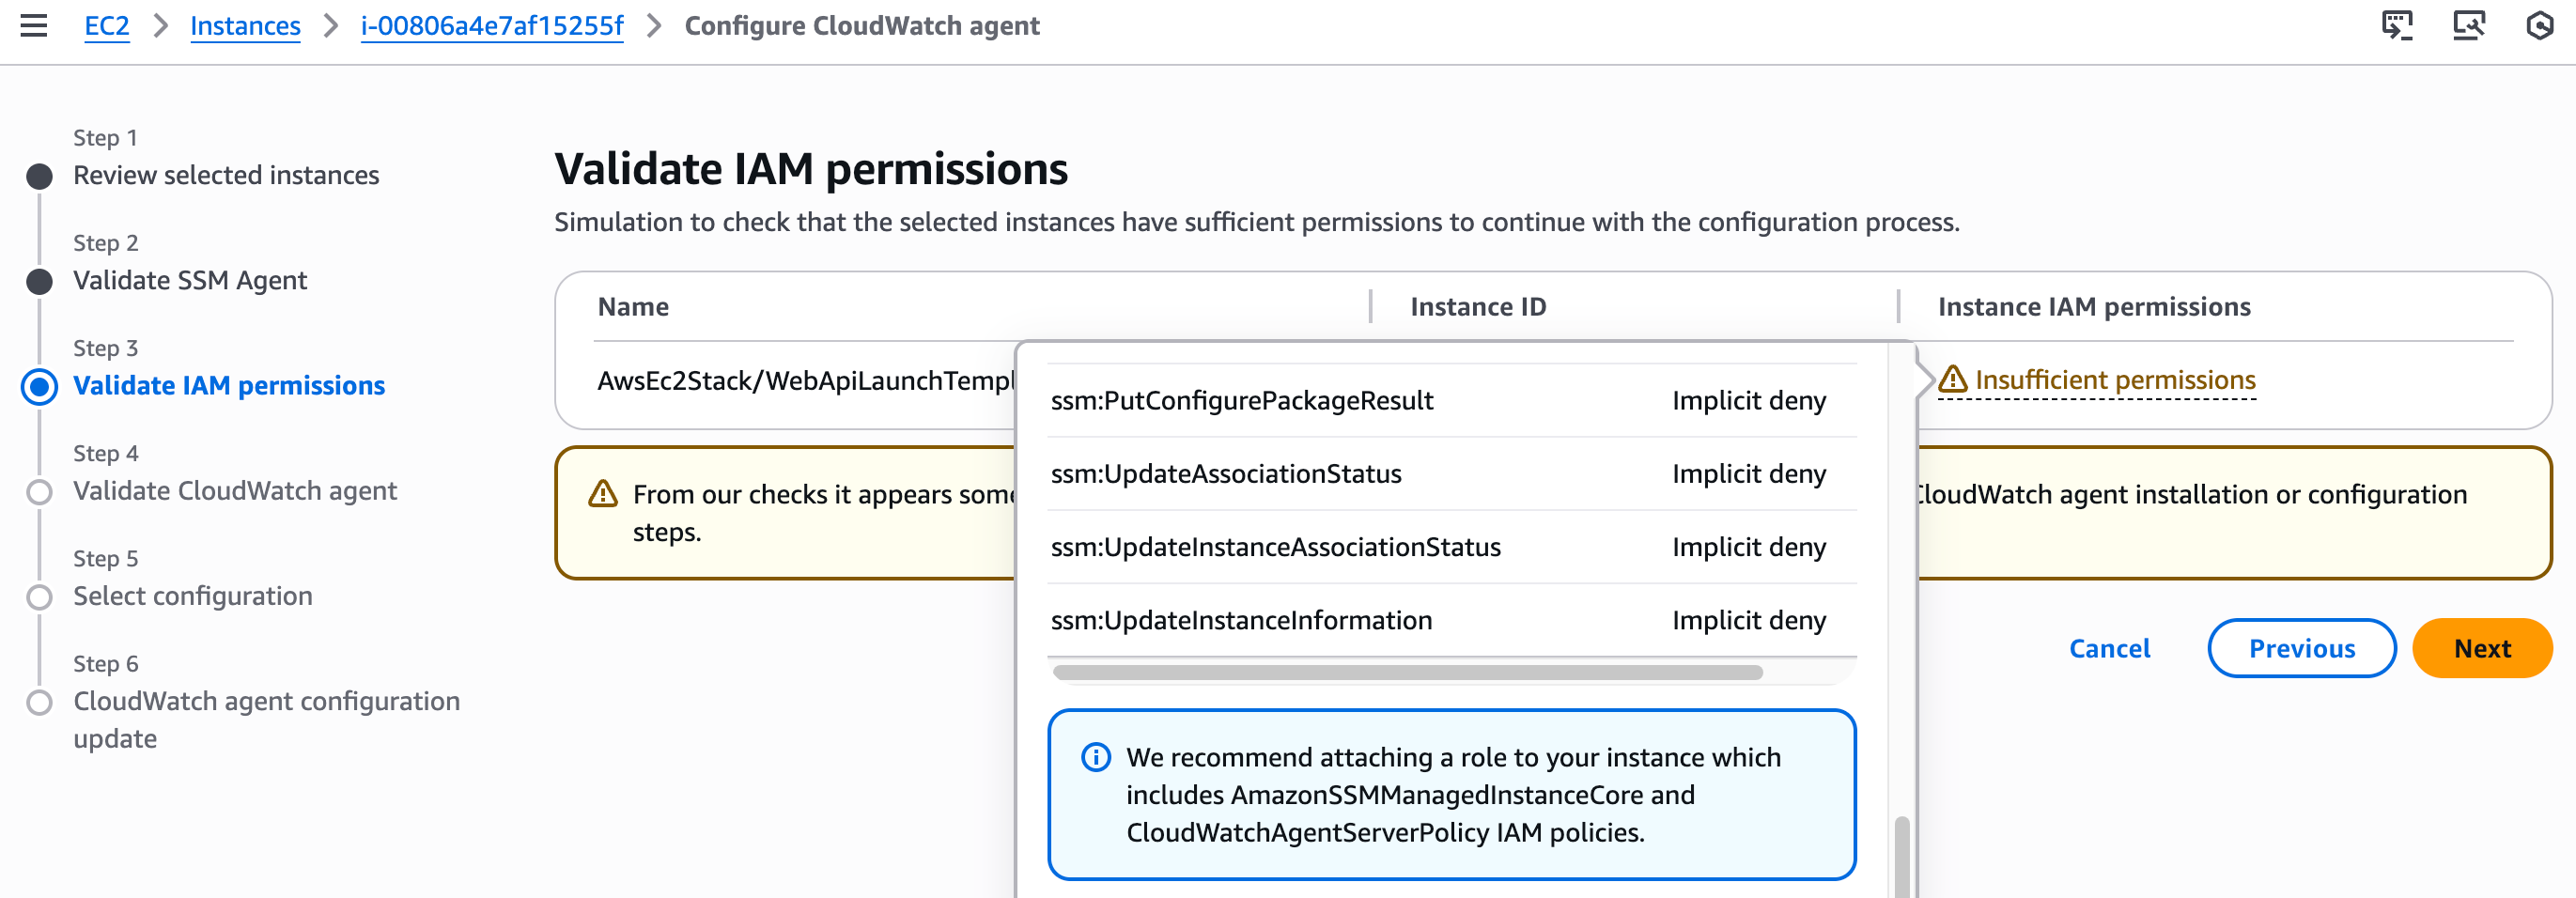
You'll need to add these managed policies to your instance's IAM role:
AmazonSSMManagedInstanceCore(for Systems Manager access)CloudWatchAgentServerPolicy(to publish metrics to CloudWatch)AmazonEC2ReadOnlyAccess(to describe volumes and other EC2 resources)
If you're using AWS CDK (like in my Auto Scaling Group setup), you can add these permissions directly in your code:
role.AddManagedPolicy(ManagedPolicy.FromAwsManagedPolicyName("AmazonSSMManagedInstanceCore"));role.AddManagedPolicy(ManagedPolicy.FromAwsManagedPolicyName("AmazonEC2ReadOnlyAccess"));role.AddManagedPolicy(ManagedPolicy.FromAwsManagedPolicyName("CloudWatchAgentServerPolicy"));
After adding the policies, deploy your CDK stack.
Amazon EC2 Auto Scaling Groups

Alternatively, you can add permissions manually from the AWS Console by navigating to IAM → Roles, finding your instance's role, clicking Add permissions → Attach policies, and searching for and attaching the required policies.
Once permissions are in place, restart the configuration wizard. Navigate to your EC2 instance, Click Configure CloudWatch agent and Click Next through the initial screens.
The wizard will check if the agent is installed. Since it's not yet installed on a fresh instance, click Install CloudWatch agent to trigger the installation via Systems Manager.
Configuring CloudWatch Metrics to Collect
Now comes the important part — choosing which metrics to collect.
The wizard provides several options:
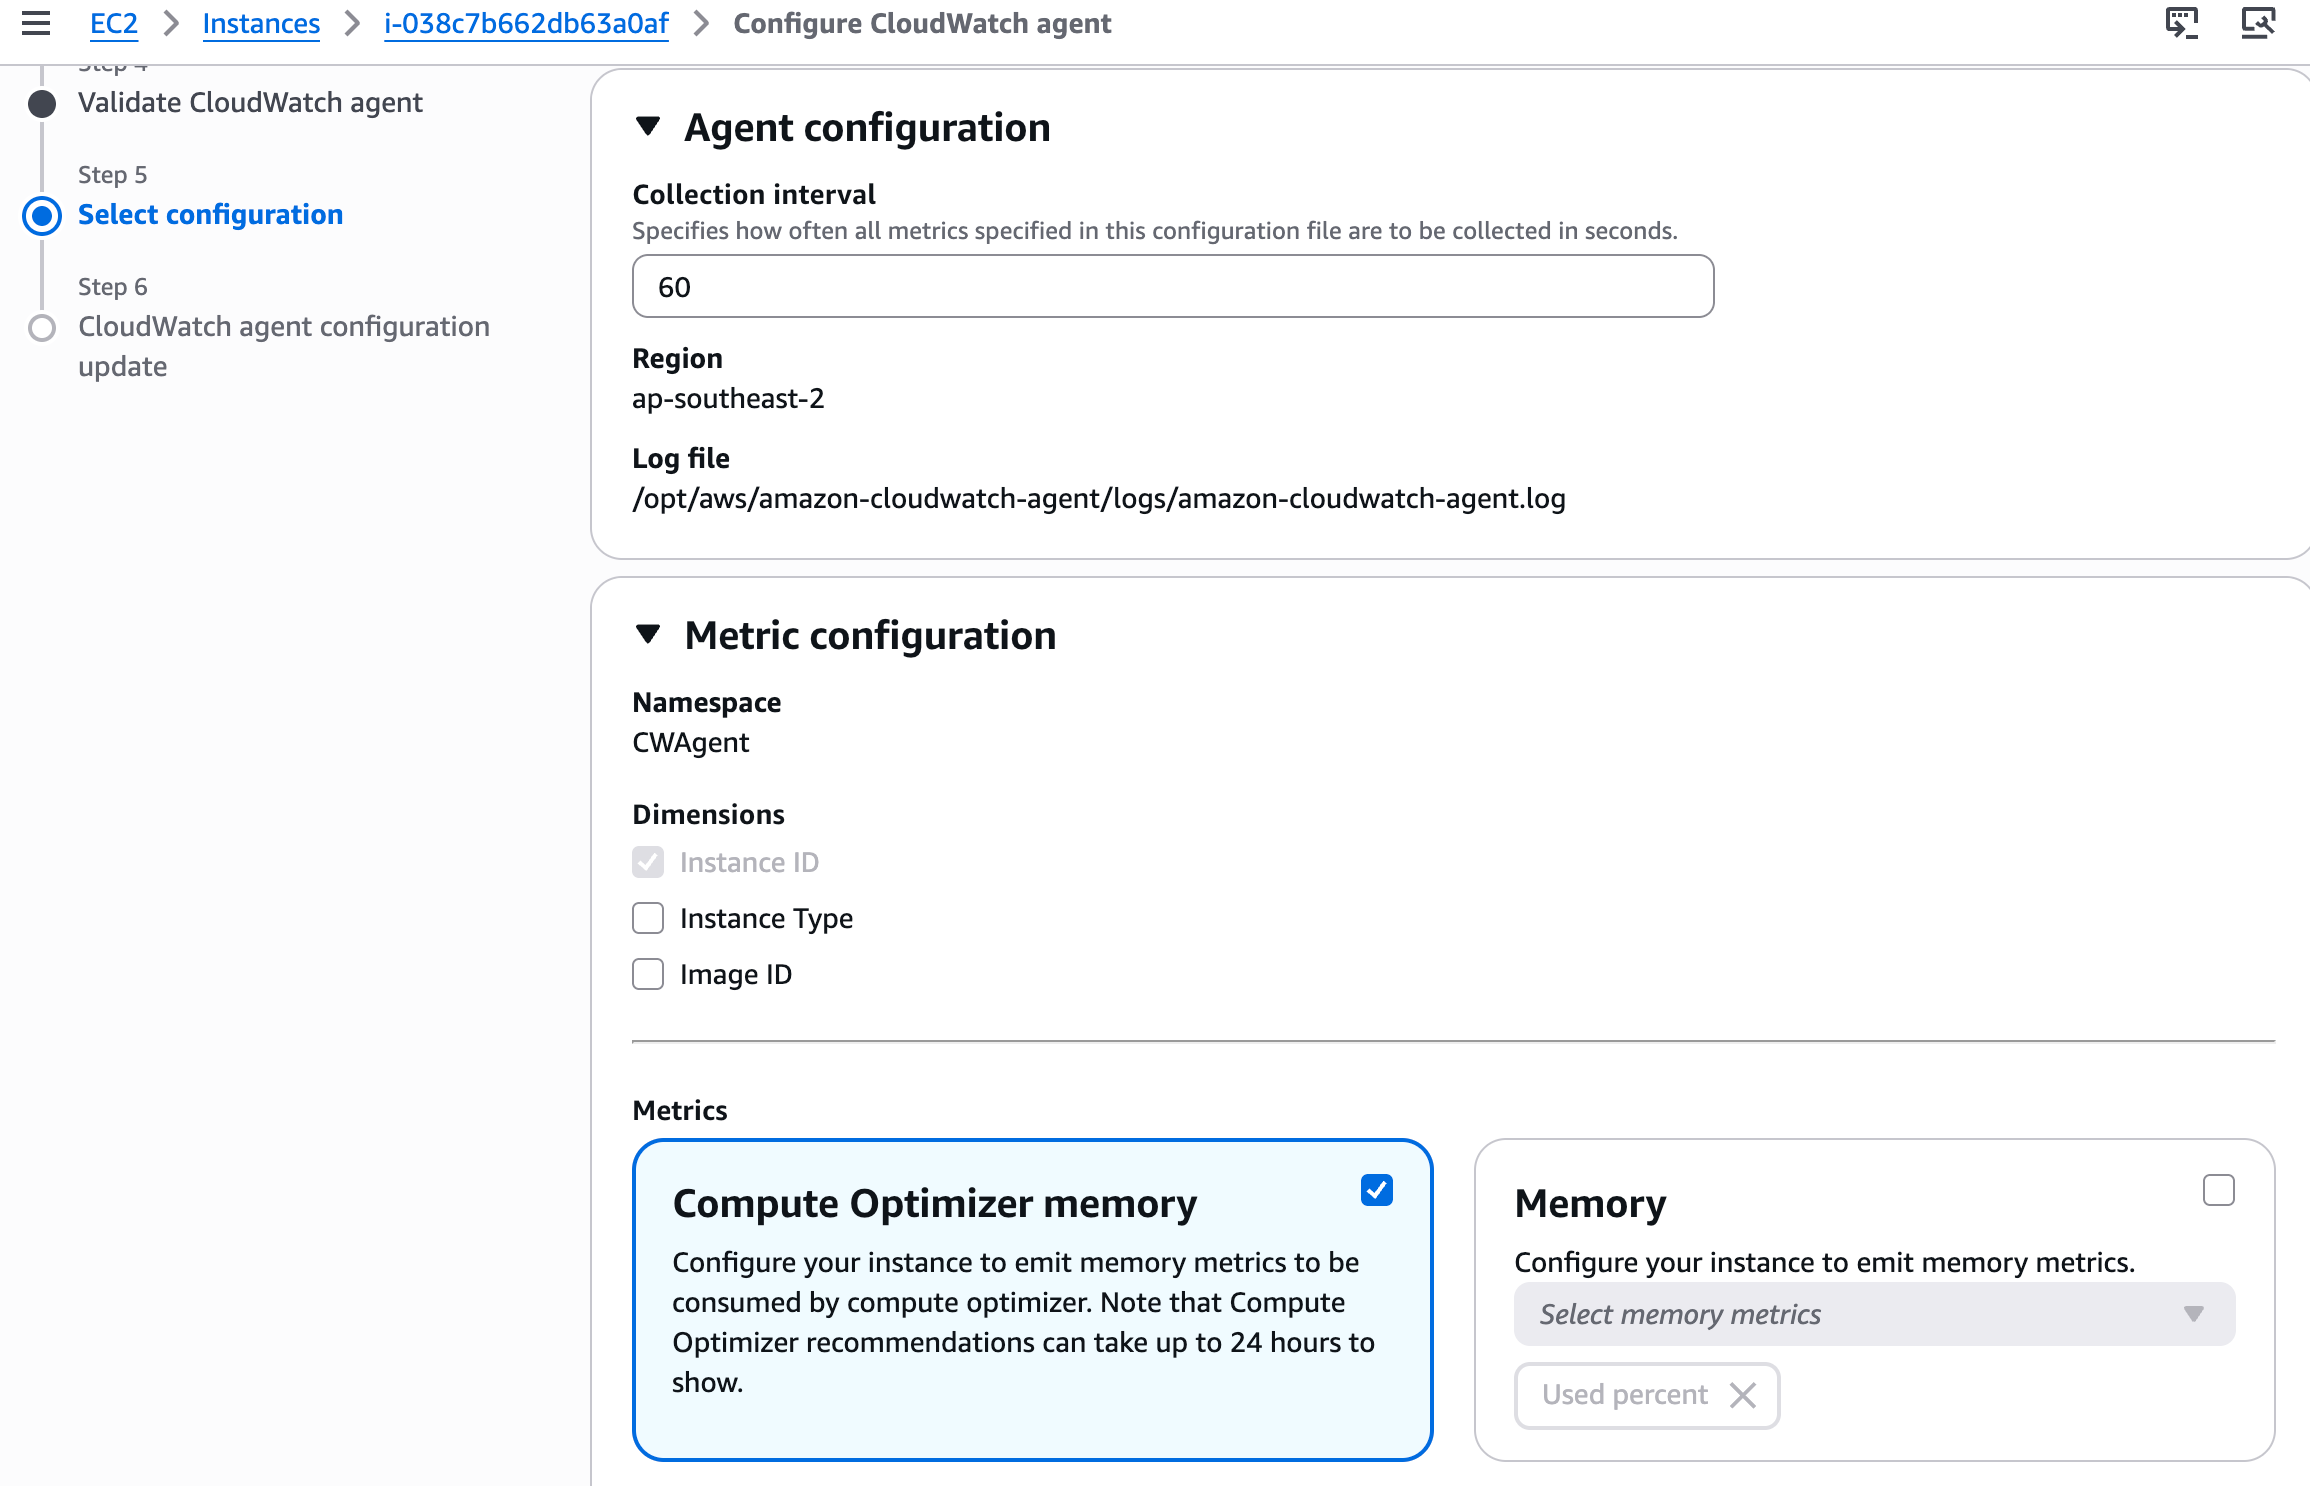
Collection Interval
- Default: 60 seconds
- Can be set as low as 1 second for high-resolution metrics
High-frequency custom metrics incur additional costs. Review CloudWatch pricing before setting intervals below 60 seconds.
The wizard lets you collect various metrics including memory (used/available percentage, total memory), CPU (usage states like active/idle/iowait, per-core metrics), disk (free space, used percentage, inode usage), and process metrics (thread count, process count, CPU and memory per process).
For this example, we'll configure memory used and available percentage, CPU usage active, and disk free space and used percentage.
Click Next and then Complete to save the configuration.
Viewing Metrics in CloudWatch
After about 60 seconds (based on your collection interval), metrics will start appearing in CloudWatch.
Navigate back to your EC2 instance and go to the Monitoring tab. Enable the option to Include metrics in the CW agent namespace to see CloudWatch Agent metrics alongside default EC2 metrics.
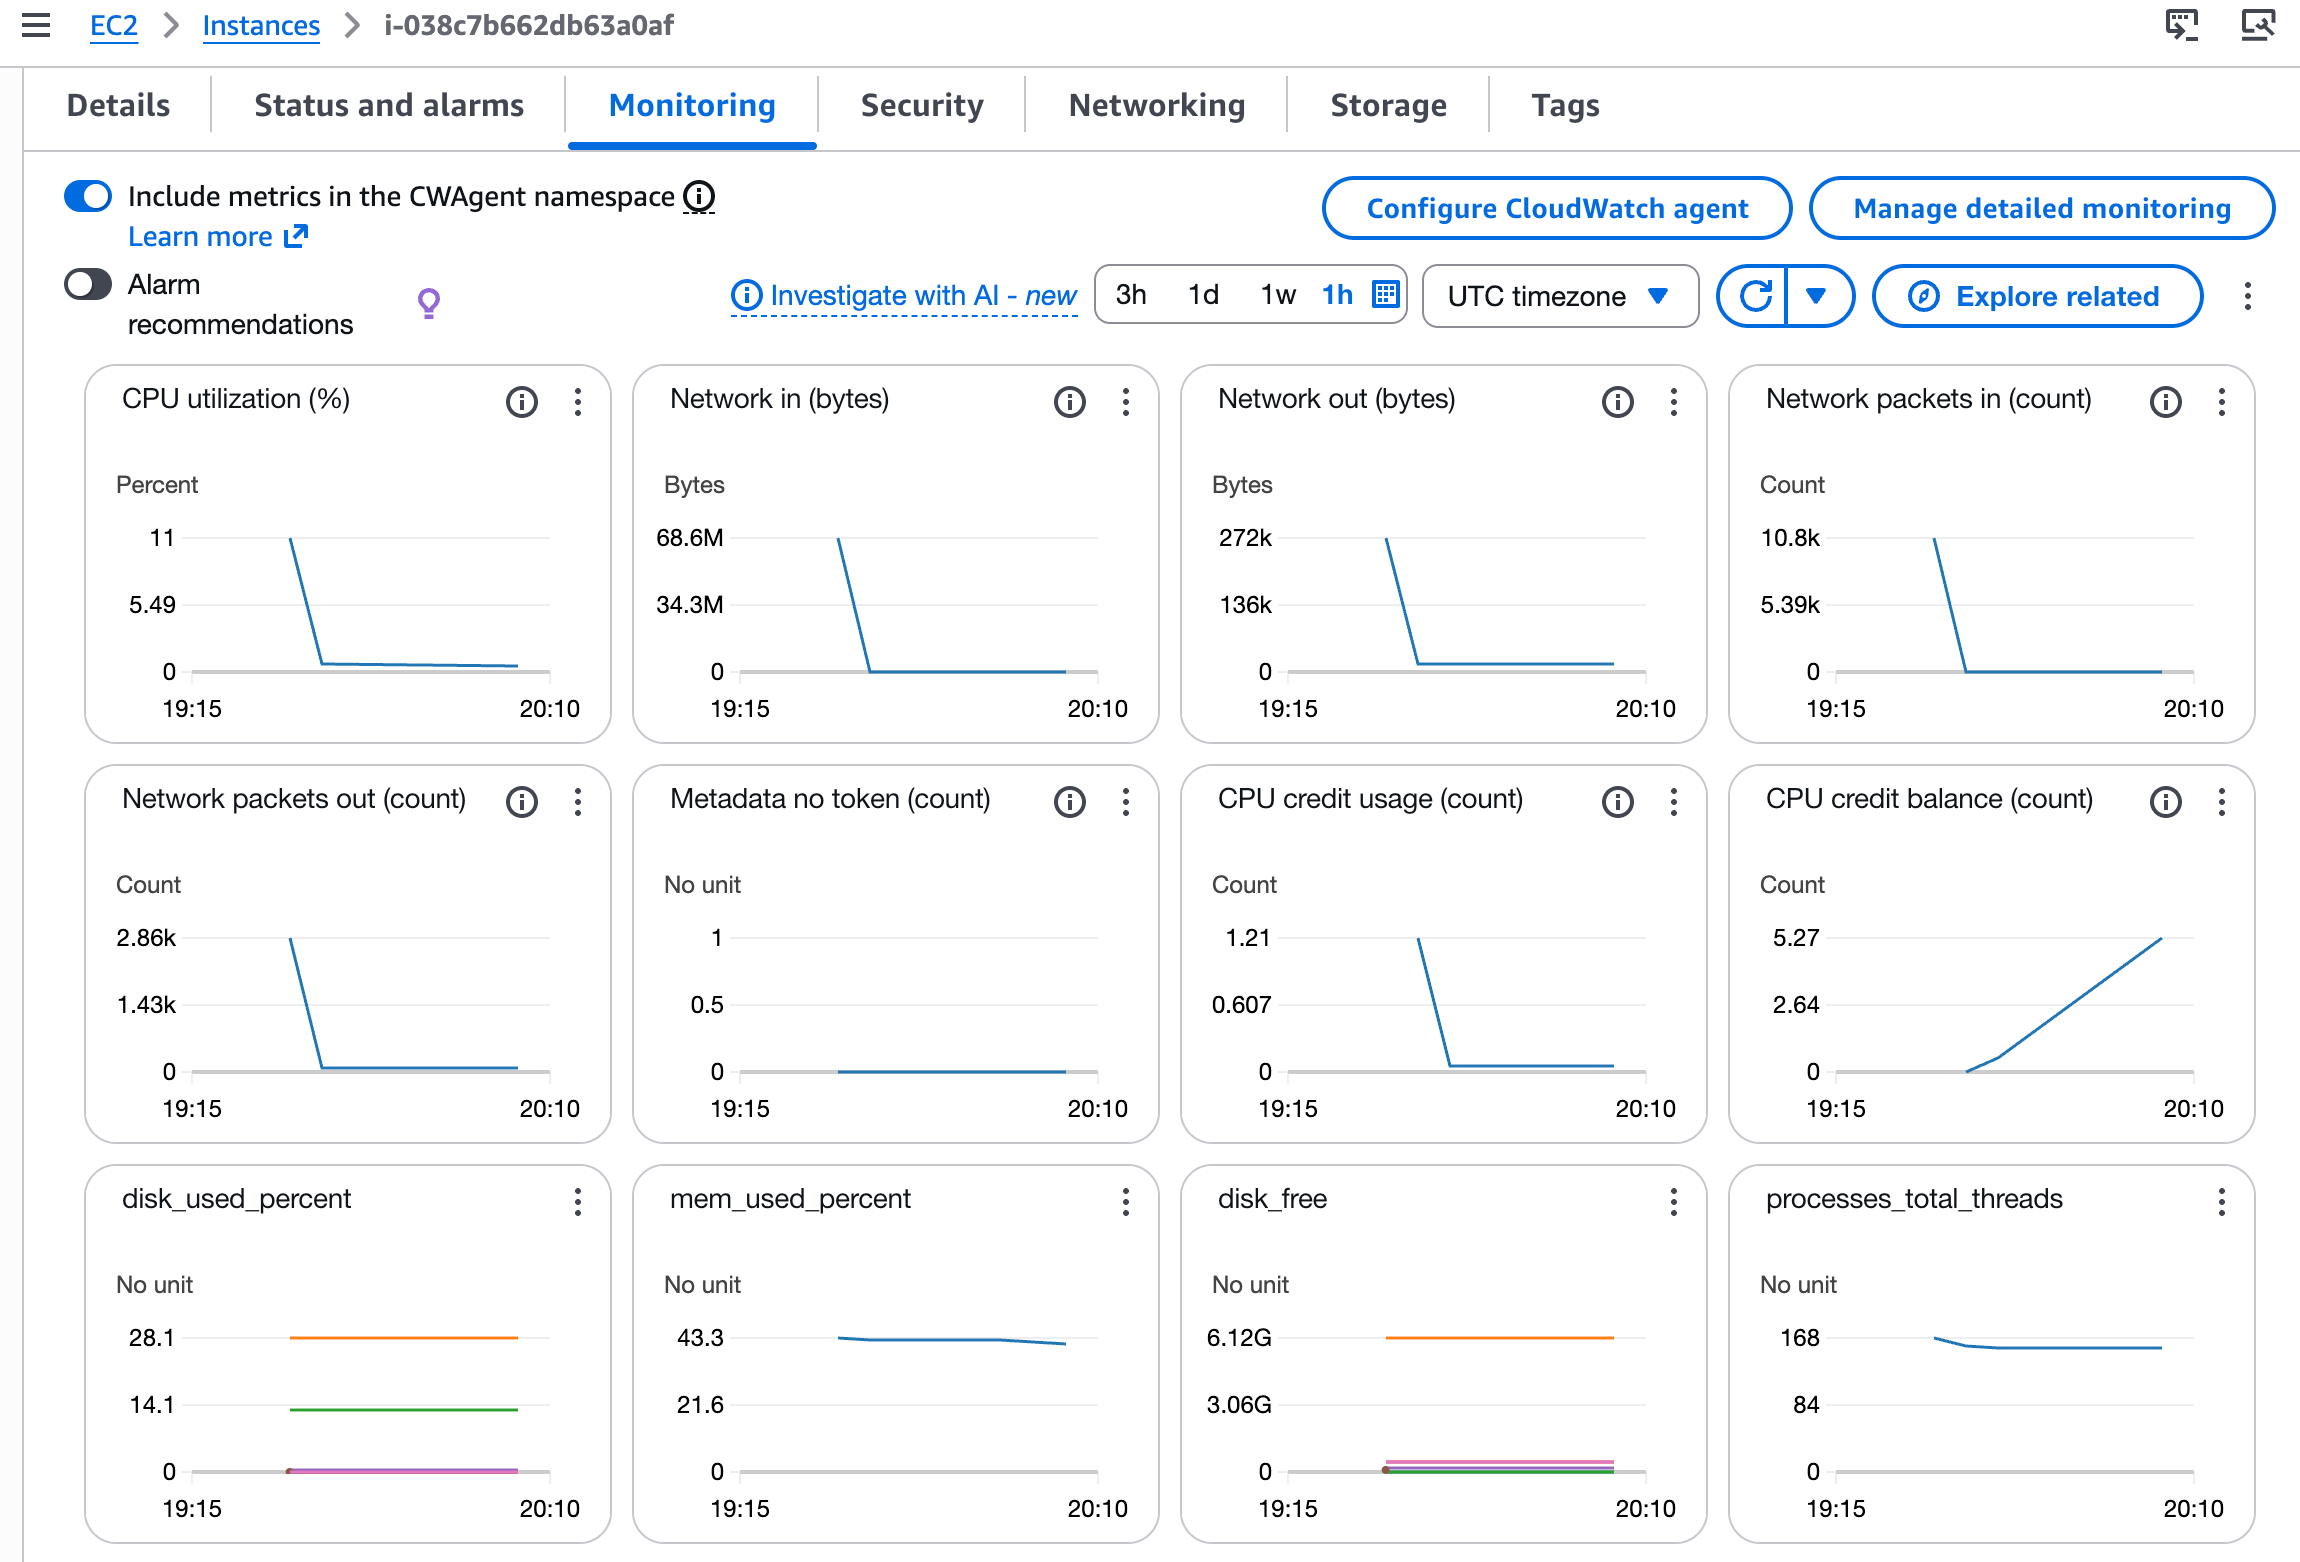
Refresh the page, and you'll see your custom metrics you have configured.
Configuring Multiple Instances
If your EC2 instances are part of an Auto Scaling Group, you'll need to configure the CloudWatch Agent on each instance individually using this manual approach.
For example, if you have two instances in your Auto Scaling Group:
- Configure the first instance (as shown above)
- Navigate to the second instance
- Repeat the same steps
Since both instances share the same IAM role, you won't need to add permissions again — just install and configure the agent.
Here's where manual configuration becomes problematic: if your Auto Scaling Group scales out and adds a third instance, you'll need to manually configure CloudWatch Agent on that instance too.
Manually installing and configuring the agent on each instance quickly becomes tedious and doesn't scale well with your infrastructure. In an upcoming article, we'll explore using User Data scripts to automate this process at instance launch.
These approaches will ensure that whenever an instance comes online, it's pre-configured with the CloudWatch Agent and the metrics you need to capture.